Economic justification for creating a network of stationary solar power plants to service the infrastructure of the city of Dnipro
21.09.2022
Economic justification for creating a network of stationary solar power plants to service the infrastructure of the city of Dnipro
Key words: solar energy for the city, energy independence, alternative energy for the city’s infrastructure, solar energy for the city’s transport.
Consideration of this topic of energy independence of large cities, relevant for our state, as never before in its entire history of independence. However, our approach to energy independence must respect our energy efficiency commitment to reduce the energy sector’s environmental footprint. The implementation of these obligations is provided for in the Energy Strategy of Ukraine for the period up to 2035 [1], which under today’s circumstances will only increase in the direction of solar energy. Among the main targeted programs of this development strategy, there is a mechanism for optimizing the structure of the energy sector of Ukraine, due to energy security with a share of renewable energy at the level of twenty percent. The purpose of this scientific post is a fundamental economic justification for the possibility of using solar energy to service the infrastructure of the city of Dnipro, which includes urban electric transport, charging stations, street lighting, and power supply to communications and energy enterprises. To evaluate such a large structure, we will use the fundamental method of scientific abstractions used to process and extract isolated criteria, such as average price, total volume, reduced power, etc. In this case, there is a separation from the secondary properties of the experimental object, focusing on the primary properties of this object. The main parameter that combines all these primary properties of the object under study is their direct resource nature, which has an actual market value and is the subject of market relations. The main results of this scientific post are the receipt and further reasoned analysis of a number of primary market criteria for the economic feasibility of introducing further project management in the direction of creating stationary power plants to meet the needs of the infrastructure of the city of Dnipro. The information obtained from the results of this scientific post is of great importance in the field of energy security of Ukraine, indicating the mechanisms for the implementation of part of the international obligations of the state with the involvement of international investment programs, as a result of which a real large city can receive strategic energy independence of its infrastructure.
Significant changes are taking place in international energy relations in approaches to the creation of the energy agenda and policies of states: the energy sector is moving from an outdated conjuncture with its large producers, deposits and storages of fossil fuels, and inefficient networks to an updated model with an active competitive environment that ensures alignment development opportunities for all interested participants in the energy market [1]. This international agenda, with its investment resources, creates unique opportunities to improve and, over time, ensure the energy efficiency of Ukrainian cities and towns. The introduction of these areas poses great economic, infrastructural and industrial challenges for Ukraine, while providing extraordinary opportunities for the development of the energy security of an energy independent state. In addition, the introduction of solar energy in large cities will improve the environmental situation both at the local and state levels. In itself, the problem of the issue lies in the urgent need to meet the needs of the strategic infrastructure of cities and settlements in alternative energy, which has a significant level of independence, especially during military operations. It is very attractive for the state energy development strategy to have large million-plus cities that would be energetically stable and could provide the energy needs of the economic component of the city as the main hub of market activity on their own [2]. In existing large cities, such as Dnipro, the introduction of solar power plants has a number of problems, such as areas for the placement of solar power plants, which need to be addressed through the rational and sometimes alternative use of existing resources. There are also different approaches to the implementation of the solar energy implementation strategy: public power generating stations and private power generating stations. An integrated approach to solving this issue with a combination of various forms of ownership is also possible, which will provide greater flexibility and stability of the energy market. Solving the issue of energy independence of large million-plus cities is a rather young problem of globalization that arose in the new millennium after 2004 as a result of deficient instability of international energy market relations and multiplied in 2022 as a result of the complex energy component of a market economy. To date, the situation is very complicated, has actually become catastrophic and threatens not only development, but also the existence of a market economy in the form in which it has been known for the last fifty years [3]. An analysis of the European practice of introducing alternative energy sources indicates the use of all opportunities by large million-plus cities: from geothermal sources to auto-seismic road generation. This is due to the fact that only three EU countries (Spain, Italy, and Greece) have significant opportunities in solar generation, while the rest of the countries have to combine the possibilities of other sources of renewable energy and improve the efficiency of existing economic systems. So far, the solution to this problem does not have one solution: each situation requires its own recipe, so for now the main focus of most European countries is shifting to electricity and heating [4]. Such measures are forced and quite seriously hinder the development of European economic and industrial formations, since each solution has its drawbacks and, if thoughtlessly copied, these drawbacks become more advantages of specific types of alternative energy sources. In fact, there is no single approach in the European energy market, which leads to a high cost of implementing heterogeneous systems, since these systems are innovative and research in nature, and the principle of serial application is not used for these reasons. The conclusions from this are only one and they are practical, as they have developed due to many attempts and mistakes: each region must choose its own path of alternative energy supply. Currently, a number of energy programs are operating on the territory of Ukraine [5], but all of them are focused on a global approach to the implementation of the ideas of alternative energy supply, which is not fully provided by all regional opportunities, including does not take into account the possibilities of large cities for the implementation of these systems, and the possibilities are, and they must take into account all available resources. An example of such a resource in our case for the city of Dnipro is the area of roofs of buildings, the use of which would significantly increase electricity generation and, already at the second stage, introduce the use of the free surface of the walls of buildings, connecting the electric networks of batteries with an increase in the energy efficiency of buildings. We will consider this issue in the above scientific post and establish its economic feasibility.
For collecting, processing and analyzing data, the most optimal method is scientific abstraction, the fundamental logical model of which is to separate from the external and internal secondary properties of the object under study, focusing on its main indicators and properties [6]. This methodology of abstracting from secondary properties requires specificity for the analysis of those indicators that are defined by the main ones. So in practice, using abstraction from secondary properties, it is possible to analyze such complex objects as infrastructure schemes of large cities, where secondary properties are combined into one economic category – a resource, fixing the main common properties. For example, each resource has a cost and is used by the economic model to create a new product or commodity. Thus, using the method of scientific abstraction for the economic justification of creating a network of stationary solar power plants to serve the infrastructure of the city of Dnipro, we get the actual liberation from ideas about the object of study, that is, the transition from a private, single, one-time, random, atypical, short-term – to a general, mass , constant, natural, typical and long. This transition allows you to study through the general phenomenon, the particular properties of the object of study. Thus, the used method of scientific abstraction needs to study phenomena, to have the same phenomena in a developed and final form. Thus, this method meets the needs of covering the energy sector of the city of Dnipro, which is in a developed and final form, although for the most part outdated. As a result of using the logical model of this method, we obtain a simplification of the relationship between economic variables included in the complex components of the object under study. These economic variables are natural financial and economic values with their inherent quantitative market value. An example of such economic variables in this case is the volume of electricity consumption, the volume of electricity production, the cost of transporting electricity, electricity consumption rates, the cost of a unit of electricity, and other indicators [7]. The above economic variables are structured and determined by both exogenous influences and endogenous factors. Thus, the amount of costs for the production of a conventional unit of electrical energy depends on: factors of the state energy policy – is an exogenous influence and factors of the applied technology of electricity production – is an endogenous factor [8]. In the future, we will consider the forms of the method of scientific abstraction, such as: analysis and synthesis, induction and deduction. For the practical use of the forms of the method of scientific abstraction, it is necessary to make a transition from the forms of the method to specifics, namely the stages of research: 1) Analysis of economic indicators is the mental division of the object of study into separate links and components, data collection and their subsequent separate systematization. The actual result of the analysis is a list of studied data for further synthesis; 2) The synthesis of economic variables is a combination of data obtained from the results of the analysis, which are scattered and uncoordinated in structured economic variables; 3) Induction of economic results is the identification and creation of interconnections of economic variables into specific interrelated patterns that can lead to final results; 4) Deduction of economic justifications – this is a comparison of the results obtained in order to obtain logical conclusions for further abstract assumptions. The mentioned abstract assumption, necessary for the construction of economic models, with different depths of penetration into economic relationships and different scopes of economic interests. These economic models will directly use the reasonable abstract assumption given in this post for a real calculation, an example of which would be equipping one micro district of the city of Dnepr with stationary solar power plants to maintain infrastructure. The substantiated abstract assumption obtained from the results of this scientific post is actually a hypothesis, that is, a trial statement about a certain pattern of circumstances and relationships between phenomena and factors in the energy sector of a big city as a separate unit of economic activity. This hypothesis needs further testing for truth.
Experimental work begins with the collection and analysis of data. In our case, this is the first stage of the method of scientific abstraction, namely, the analysis of economic indicators. Under the conditional operation of future solar power plants, the value of their energy generation will be affected by the deviation from the optimal conditions of a number of factors, including: 1) Deviation of the angle of the solar flux from the optimal value specified in the operational documentation, which affects the level of energy generation and indicates compliance with the optimal operating mode; 2) The average annual specific power of the flow, which depends mainly on the geographical location and gives an understanding of the volume of energy generation; 3) The temperature of the contact surface, affecting the losses in generating elements and losses during power generation; 4) Humidity of the environment, affecting the durability and life of the energy generating elements of the solar power plant; 5) Dusty environment, affecting the frequency of maintenance and the maximum level of energy generation; 6) Efficiency, which directly affects the level of energy generation and decreases with the time of operation, and indicates the overall efficiency of the system; 7) The battery utilization factor, which affects the life of the batteries and indicates the degree of their use; 8) The coefficient of operational maintenance, which affects the serviceability of the system and indicates compliance with the requirements of operational documentation. Let’s move on to collecting data on solar activity parameters [1]. For the city of Dnipro, it is about ±23.5 ̊. The scheme for measuring the deviation of the solar angle is shown in Figure 1.
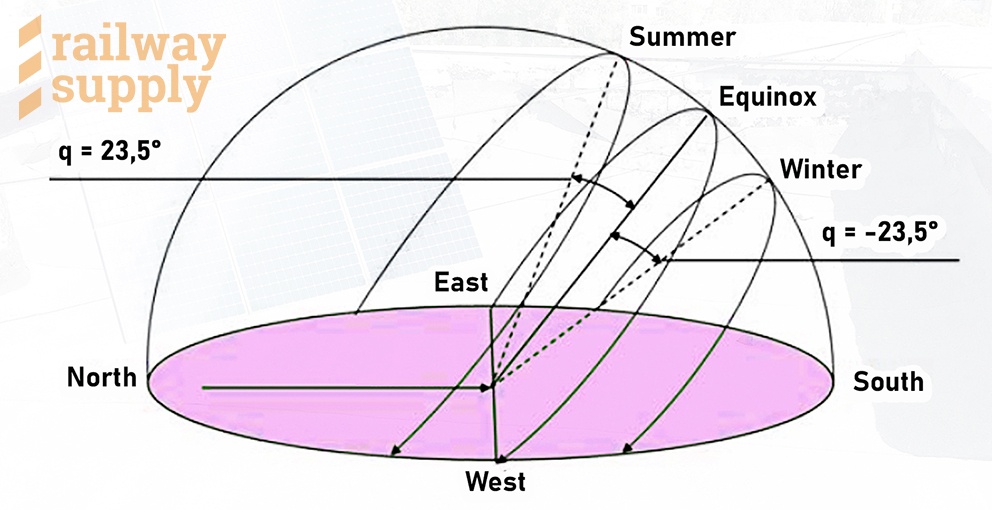
Figure 1. Deviation of the solar flux angle for the city of Dnipro
As a location area for energy generating elements, we conditionally choose the most optimal and unused resource of any city – the roofs of buildings, both residential and industrial, as well as commercial. Now we determine the data on the average annual specific power of the solar flux [10]. For the Dnipro, it averages approximately E = 1250 kW/m2 per year. The scheme for measuring the solar flux is shown in Figure 2, [10].
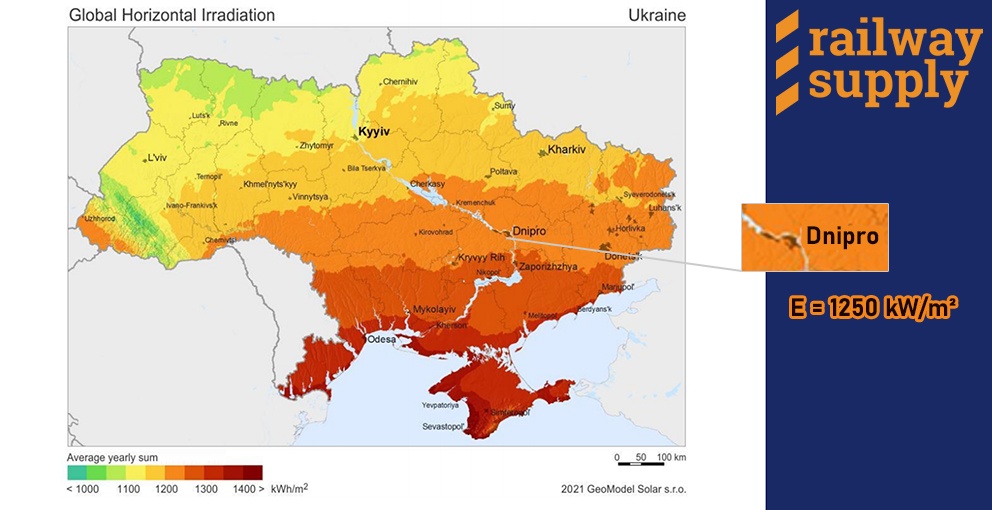
Figure 2. Average annual specific power of the solar flux in the period from 2016 to 2020
Let’s move on to collecting data on the environment. We determine the temperature of the contact surface, which for the city of Dnipro, according to the Global Solar Atlas in Figure 2, ranges from -25 C to +55 C, depending on the season [10]. The humidity of the environment is no more than 85% in some seasons. An important parameter for the city of Dnipro is the dust content of the environment, which, depending on the season, averages from 0.02 to 0.08 mg/m3.
Let’s move on to collecting data on the operational parameters of a conditional solar power plant. According to manufacturers’ information, reduced to a common denominator, the efficiency of generating elements ranges from 18% to 22% depending on the season [11], [12], [13]. The battery utilization rate is from 40% to 20% depending on the availability of consumers. The maintenance factor ranges from 80% to 95% depending on qualifications and compliance with regulations. As a result of the received data, we create their list in Table 1.
Table 1. Main nominal environmental factors of solar power generation
|
№ |
Condition name |
Summer |
Winter |
|
1 |
Sun angle deviation, q |
+23,5 ̊ |
-23,5 ̊ |
|
2 |
Average annual flow rate |
1250 kW/m2 |
|
|
3 |
Contact surface temperature |
≤ +55 ̊ С |
≥ -25 ̊ С |
|
4 |
Ambient humidity |
≤ 85% |
≤ 70% |
|
5 |
Dusty environment |
≤ 0,08 mg/m 3 |
≤ 0,02 mg/m 3 |
|
6 |
Efficiency of elements |
≥ 22% |
≥ 18% |
|
7 |
Battery Utilization Rate |
≥ 20% |
≥ 40% |
|
8 |
Maintenance factor |
≥ 95% |
≥ 80% |
Source: compiled by the author based on data [11], [12], [13]
An important economic indicator for further data collection is the lifetime of solar power plants reduced to cost per unit area, which is formed from the cost of various operational components of solar power equipment and is taken in accordance with the experience accumulated by manufacturers since 2010 [11], [12], [ 13].
Table 2. Cost-per-unit lifetime of a conventional solar power plant under nominal conditions of environmental factors of power generation
|
№ |
Name of components |
Average operating period |
Present value per 1 kW/m2, in [€] |
|
1 |
Photovoltaic panels |
20 years/175,200 hours |
240 (4х250 W) |
|
2 |
Frames, fasteners, lightning protection |
20 years/175,200 hours |
120 (4 sets) |
|
3 |
Batteries, stabilizers |
20 years/175,200 hours |
880 (2 sets) |
|
4 |
Power plant control systems |
20 years/175,200 hours |
240 (2 sets) |
|
5 |
Power conversion systems |
20 years/175,200 hours |
320 (2 sets) |
|
6 |
Cables, wires and terminal connections |
20 years/175,200 hours |
240 |
|
7 |
Enclosures for electrical equipment |
20 years/175,200 hours |
120 |
|
8 |
Operational maintenance |
20 years/175,200 hours |
1460 |
| Present cost of generation per 1 kW/m2: |
20 years/175,200 hours |
3620 |
|
Source: compiled by the author based on data [11], [12], [13]
Having received the main economic indicators and the ratio of the operating time to its cost, reduced to the area, it remains only to determine this useful generation area. Since the method of scientific abstraction is used, the useful area will be taken into account further. Let’s move on to collecting data on the area on which future solar power plants can be conditionally located. As suggested at the beginning of the section, it is advisable to select the optimal and untapped resource – the roofs of buildings, both residential, industrial and commercial. Now we determine the quantitative indicators for the Dnipro in Figure 3.

Legend:
8% – shopping centers, shops, supermarkets; 22% – residential buildings above 4 floors; 32% – residential buildings up to 4 floors; 38% – industrial buildings and warehouses.
(Dear colleagues, in connection with the hostilities, all the data provided are indicative, and the plan of the city of Dnipro is devoid of detail, thank you for your understanding)
Figure 3. Type of development in the city of Dnipro according to the general plan
After analyzing the data obtained, we assume that all building owners have agreed to free installation of solar power plants on the roofs. According to the General Plan of the city of Dnipro, the area of the city is approximately 410 km2 [14]. Of these, the built-up area of the territory is approximately 272 km². We assume that the built-up area is equal to the roof area of the buildings, ignoring the slope of the roof on the buildings, thereby balancing the part of the building whose roof is not suitable for use as a base for power generating panels. That is, the generation area is approximately 272 km² and we have all the necessary analysis data to proceed to the next stage of synthesis.
Having received the input data of the study, we proceed to the second stage of scientific abstraction, namely the synthesis of economic variables. The economic justification is determined by the degree of economic efficiency of the project, which is noted from the following synthesized economic variables.
Calculation of capital investment in the construction of the plant for the year:
Kt = Ʃ Kbs + Ʃ Kie + Ʃ Kipc, (1)
where: Kt – investment in the construction of the plant for the year t, [€];
Ʃ Kbs – the amount of investment in building structures, [€];
Ʃ Kie – the amount of investment in individual elements of a solar power plant, [€];
Ʃ Kipc – the amount of associated capital investments, including pre-production costs, [€];
Calculation of the investment given in time before the start of the billing period:
Kci = Ʃ Kt / (1+ E) • t, (2)
where: Kci – capital investments given in time before the start of the billing period, [€];
Ʃ – the sum of Тcon with step t=1, where Тcon is the duration of construction in years [-];
Kt – investment in the construction of the installation for the year t, [€];
Е – accepted interest rate (discount rate), [%].
Calculation of depreciation costs for new equipment:
Bcne = αd • Kci, (3)
where: Bcne – depreciation costs for new equipment, [€];
αd – the rate of deductions for depreciation of equipment, [€];
Kci – capital investments given in time before the start of the billing period, [€];
Calculation of the cost of repair and maintenance of new equipment:
Brne = αr • Kci, (4)
where: Brne – the cost of repair and maintenance of new equipment, [€];
αr – the rate of deductions for the repair and maintenance of equipment, [€];
Kci – capital investments given in time before the start of the billing period, [€];
Calculation of current costs associated with the operation of new technical means:
Вo = Bcne + Brne (5)
where: Вo – current costs associated with the operation of new technical facilities, [€];
Bcne – depreciation costs for new equipment, [€];
Brne – the cost of repair and maintenance of new equipment, [€].
Having obtained the value of all necessary investments, we find that for the design work for an area of 272 km² it is necessary to spend approximately 46,160,000 € for one year. In the process of determining the costs before the start of the period, it is assumed that the projects are of the same type, of the same complexity and have complete unification with each other. For the implementation of the construction of solar power plants on an area of 272 km², it is necessary to spend approximately 984.64 million euros. In the process of determining the costs for the construction of the installation (hereinafter, the complex of solar power plants is considered as one installation), it is assumed that this installation will be built in one calendar day, and the construction work will be of the same type, of the same complexity and have complete unification with each other. We turn to the synthesis of economic variables related to the revenue side:
Profit calculation:
P = ΔЕ – Вo, (6)
where: P – profit, [€];
ΔЕ – the cost of resources, [€];
Вo – current costs associated with the operation of new technical facilities, [€];
Calculation of net income growth:
NI = (P – PT) • (1 – Tir / 100), (7)
where: NI – increase in net income, [€];
P – profit, [€];
PT – property tax, [€];
Tir – the current income tax rate, [%].
Calculation of annual income:
IY = NI – Bcne, (8)
where: IY – income received in year t, [€];
NI – increase in net income, [€];
Bcne – depreciation costs for new equipment, [€];
Calculation of net present value:
NPV = Ʃ IY / (1+ E) • t – Вo, (9)
where: NPV – net present value, [€];
Ʃ – the sum of Тcon with step t=1, [-];
IY – income received in year t, [€];
Вo – current costs associated with the operation of new technical facilities, [€];
Е – accepted interest rate (discount rate), [%].
The calculation was made taking into account the profitability of the feed-in tariff in Ukraine, which today is for the city of Dnipro and the region, from 1.79 UAH/kW•h to 7.55 UAH/kW•h. (without VAT). For the calculations, a tariff of 5.0 UAH/kW•h, that is, 0.14 €/kW•h, is taken into account, taking into account the real situation and the further development of the Ukrainian economy. In this case, the payback period will take into account the costs of designing and implementing the project, referred to its annual income.
Payback period of the project:
PP = Ʃ (Kt + Kci) / IY, (10)
where: PP – payback period of the project, [year];
Ʃ – the sum of investments T with a step t=1, [-];
Kt – investment in the construction of the plant for the year t, [€];
Kci – capital investments given in time before the start of the billing period, [€];
IY – income received in year t, [€].
Calculation of the economic efficiency ratio:
Kee = PP • NPV / (Kt + Kci), (11)
where: Kee – coefficient of economic efficiency, [-];
PP – payback period of the project, [year];
NPV – net present value, [€];
Kt – investment in the construction of the plant for the year t, [€];
Kci – capital investments given in time before the start of the billing period, [€]/
(Dear colleagues, due to hostilities, all the data provided are indicative, and the calculation is devoid of detail, thank you for your understanding)
The data obtained indicate that the economic efficiency ratio of the project is approximately equal to 72%, which is a fairly moderate value for investment attractiveness, but means that all risks are taken into account. For example, for 2021, the present value of generation per 1 kW/m2 for actually sold solar power plants ranged from 800 € to 1500 €, however, taking into account the risks and trends, the calculation was made with the present value of generation per 1 kW/m2 in 2023-2024 equal to 3620 €. This trend is already predictable, and it establishes the risks of increasing the cost of products of the main global manufacturers, components for solar generation and energy [15].
Having obtained the synthesis of economic variables, we proceed to the third stage of scientific abstraction, namely the induction of economic results, that is, the use of economic variables in price economic models with obtaining the final results listed in Table 3.
Table 3. Induction of economic results of a conditional solar power plant under nominal conditions of the environmental factors of energy generation
|
№ |
Cipher |
Parameter name |
Value |
|
1 |
Kt |
Capital investment in the construction of the plant for the year t |
984 640 000 € |
|
2 |
Kci |
Investments given in time before the beginning of the period |
46 160 000 € |
|
3 |
Bcne |
Depreciation expense for new equipment |
4 154 000 € |
|
4 |
Brne |
Repair and maintenance costs for new equipment |
1 385 000 € |
|
5 |
Вo |
Operating expenses |
5 539 000 € |
|
6 |
P |
Profit |
61 186 000 € |
|
7 |
NI |
Net Income Growth |
93 667 000 € |
|
8 |
IY |
Income received in year t |
89 513 000 € |
|
9 |
NPV |
Net present value |
67 071 000 € |
|
10 |
PP |
Payback period of the project |
11 years |
|
11 |
Kee |
The coefficient of economic efficiency of the project |
72% |
Source: compiled by the author based on the input data of the first stage and the mathematical model of the second stage of the scientific abstraction method of this post
Next, we carry out a simulated induction of the payback period for a solar power plant project in the city of Dnipro, reduced to the life of this system, which, in accordance with the manufacturer’s guarantees, is at least 20 years. According to the terms of the Energy Strategy of Ukraine, for the period up to 2035 [1], the economic indicators of green energy generation remain quite attractive at least until 2035 inclusive. The payback process will be influenced by the model of random risks associated with predictable economic factors of the international market [16]. Given the above circumstances, the induction of economic results in the payback period for the entire operating life will look like Figure 4.
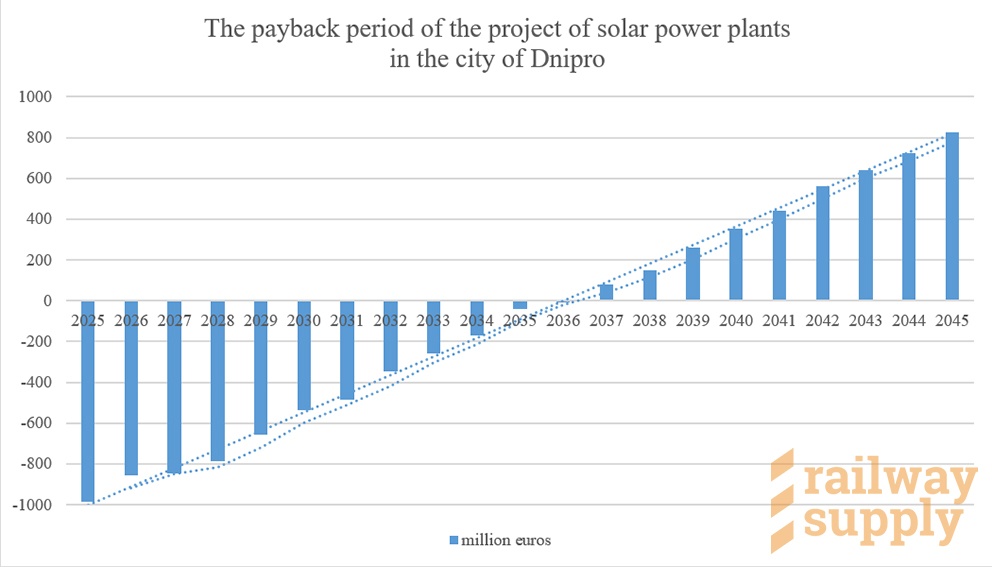
Figure 4. Induction of economic results of the payback period for the entire life of the solar power plants in the Dnieper
By analyzing the results shown in Figure 4, it was found that the probable economic situation, taking into account global risks, does not pose a significant threat to the implementation of the project, and the trend trends by difference do not exceed 3% of the total investment in the project. Thus, upon completion of the three stages of the scientific abstraction method, we have everything necessary to complete the fourth stage, namely, the deduction of economic justifications for the implementation of the project to create a network of stationary solar power plants to service the infrastructure of the city of Dnipro.
The deduction of economic justifications for the implementation of the project is the fourth final stage of the method of scientific abstraction and consists in the analysis and comparison of the scientific research obtained in the previous stages. According to the experience of European states, the introduction of solar energy is an individual project in understanding concepts and approaches, and for each case it will be different [17]. Therefore, the beginning of the justification for the implementation of the project takes place with an analysis of the needs of the electricity market in the city of Dnipro, which currently consists of three main sources: nuclear generation, thermal generation and hydro technical generation. Solar generation of the city is less than 2-3% of the total and does not significantly affect the overall picture of the city’s energy distribution. It is for such projects that the majority of international lending and financial support programs are directed, which provide for the use of new resources with access to new levels of electricity generation technology [18]. Now let’s move on in detail to the consideration of the relevance of this energy project. Thus, according to the problematics, the main issue is the energy supply of the systems of the city of Dnipro, for which needs an average of 5000 MWh is needed. Of this, the cost of electricity to maintain the infrastructure of the city of Dnipro is approximately 35% of the total costs, that is, 1750 MWh. This volume includes: street and territory lighting, urban electric transport (metro, tram, trolleybus), strategic facilities (water supply, gas networks, communications, Internet) and other systems (elevators, filling and charging stations). This volume does not include railway infrastructure that has its own power sources. In this case, the volume of the future solar generation of stationary solar power plants for servicing the infrastructure of the city of Dnipro is, according to the third stage, approximately 2230 MWh, which fully meets the needs of the city in powering the infrastructure and its facilities in accordance with the average and absolute peak load values.
(Dear colleagues, due to hostilities, all the data provided are indicative, and the calculation is devoid of detail, thank you for your understanding)
The justification for the implementation of the project in accordance with the daily energy supply schedule for the infrastructure of the city of Dnipro is that, unlike the general energy supply schedule, the energy supply schedule for the city infrastructure has two large peak loads of the same type, 4 hours each, which occur in the morning and evening when the population of the city moves to and from work. Peak loads have significant deviations from a clear regular distribution, and are not described by a clear logic model. In this connection, the big advantage of solar generation is the rapid change in the amount of generation to provide the required load. According to Figure 4, there is a list of economic results of the payback period for the entire life of solar power plants in the city of Dnipro, from which it can be seen that the payback period of 11 years fully suits the investment feasibility of this project, since the terms of the Energy Strategy of Ukraine expire in 2036. This payback period of 11 years is normal for the European practice of implementing similar projects and has investment feasibility [18]. In the scope of the comparative analysis of European practice, when determining the most profitable investment option, the project’s economic efficiency ratio is also used, which for this project has a value of 72%, which in turn means a medium-high level of economic attractiveness. It should be noted that according to the European practice of investment design, this economic parameter is used only for conducting a comprehensive analysis, and the payback period, as a separate main economic efficiency factor, is almost never used. An exception to using the payback period as a separate main economic efficiency factor is the investment conditions when the project is focused on a quick return on investment: for example, it can be a small solar station of a private house. Therefore, in itself, the coefficient of economic efficiency of the project above 70% is already economically feasible and attractive. However, it should be considered that in European practice, investment, ceteris paribus and opportunities, the investment choice is given to those project proposals that have the highest coefficient of economic efficiency, and hence the shortest payback period of the project [19]. Since the basis for the implementation of this project is based on debt financing, it is extremely important that the payback period is no longer than the period of provision and servicing by external borrowing. In our case, when the payback period is 11 years, and most borrowings from international organizations are no more than 10 years, then according to Figure 4, in 2035 and 2036 state support will be required at the level of 20,000,000 €, which is quite possible within the framework of Ukraine’s lending to its energy projects and does not constitute an investment problem in general [1].
In addition to the obvious economic motivations, the creation of a network of stationary solar power plants to serve the infrastructure of the city of Dnipro has a great social and environmental potential: the implementation of this solar energy project makes sense in terms of savings on utility bills by reducing the cost of generating electricity, which for an ordinary user will make a discount from 10% to 20% for the use of a number of communal resources (electricity, water, gas, communications, heating). In addition, one of the strategic advantages of implementing this project is to ensure the energy independence of the infrastructure of the city of Dnipro from electricity suppliers, reducing the dependence on imports of foreign energy resources. Thus, in the event of emergency energy situations, city residents will have a guaranteed basic level of services. For example, power supply of the next electric transport, water supply, power supply of freezers of the food chain, and power supply of medical and communication institutions with electric energy. In addition to the above independence, the energy system of solar power plants is autonomous due to batteries in case of emergency situations, and ensures the stability of the infrastructure and infrastructure facilities in case of unstable operation of the external energy chains of the city of Dnipro. An example of such a situation can be a power grid failure at night, which in the usual case will exceed an emergency situation on a city scale, but due to the autonomy of static solar power plants, the city will be overcome almost without restrictions. Considering this project for the implementation of static solar power plants to power the infrastructure of the city of Dnipro, and in comparison with other types of generation, it should be noted that future solar power plants are neutral in terms of street emissions per 1 kWh, which makes their use expedient in the next 20-30 years. and provides a significant economic advantage to goods and services that will be produced and provided by the city of Dnipro, since when exporting such goods, such goods will not experience economic tax pressure in terms of environmental international legislation [20].
Summing up the above, it should be noted that the project is extremely large-scale and its real implementation will most likely take place in stages, depending on the volume of financing of energy efficiency programs by investment funds. But any big goal begins with an intention that has a first justification stage, the so-called investment intelligence, for which this scientific post will be extremely useful and will allow you to start not from scratch, but from some foundation. In itself, the justification for the implementation of the project by the deduction method has fulfilled its function in the scope of the economic method of scientific abstraction, and further development of this topic is already expected in specific design works, where assumptions will be replaced by measurements and drawings. Therefore, for the logical conclusion of the scientific work, let’s move on to the conclusions of this post.
The economic justification for creating a network of stationary solar power plants to serve the infrastructure of the city of Dnipro reached its logical goal, and, using scientific methods, confirmed in a first approximation the feasibility of creating such an energy generating model. The established advantages of this post for such a system of solar stations are: energy independence, conditional autonomy, high environmental friendliness, ease of maintenance and repair, and low cost of generating electricity. The introduction of this solar generation system will strengthen the existing energy system of the city of Dnipro, increasing its stability, and will also reduce the tariff burden on city residents with an improvement in the environmental situation. A separate advantage of such a system is its high strategic importance during emergencies and hostilities that can completely destroy the usual power supply system of any city, but are not capable of completely destroying thousands of small solar power plants scattered across buildings for various purposes, which can be used both to power residential ones. buildings, and to supply medical institutions or strategic enterprises. Complete unification of such a system of static solar power plants allows for the replacement and repair of elements of power plants in the shortest possible time. In addition, there are real opportunities to raise funds for further design and implementation of the system from international financial institutions such as the International Bank for Reconstruction and Development, the International Renewable Energy Agency and others. The commissioning of this system of stationary solar power plants is advisable with the opening in the city of Dnipro of a plant for the production of components for partial localization, which will create new jobs and reduce the cost of maintenance for the period of operation of the solar station. Therefore, we should continue to popularize this direction in the future and look for investments in the implementation of this and similar projects, since they will have a future, especially in such difficult energy circumstances that think tanks of European financial institutions are already predicting for the next fifty years.
Dmitry Klyuchnikov
Sources of information and literature references (original language)
1. Міністерство енергетики України, Звітність з реалізації етапів урядової програми України «Енергетична стратегія України на період до 2035 року» (2021), http://mpe.kmu.gov.ua/minugol/control/uk/publish/article?art_id=245239564&cat_id=245239555.
2. Верховна Рада України, Закон України Про альтернативні джерела енергії (2021), https://zakon.rada.gov.ua/laws/show/555-15#Text.
3. International Renewable Energy Agency (IRENA), Renewable Power Generation Costs in 2021 (2022), https://www.irena.org/publications/2022/Jul/Renewable-Power-Generation-Costs-in-2021.
4. International Energy Agency (IEA), Analysis report (2022), https://www.iea.org/analysis.
5. Міністерство енергетики України, “Розвиток відновлюваної енергетики в Україні” (2021), https://saee.gov.ua/uk/activity/mizhnarodne-spivrobitnytstvo/proekty.
6. Г. Г. Стрелкова, М. М. Федосенко, А. І. Замулко, О. С. Іщенко (2019) Основи наукових досліджень. Електроенергетика, електротехніка та електромеханіка, Київ: КПІ ім. Ігоря Сікорського, 120 с.
7. Міністерство енергетики України, Сонячна енергетика, Фінансова модель сонячної електростанції потужністю 1 МВт (2021), https://saee.gov.ua/uk/activity/vidnovlyuvana-enerhetyka.
8. International Energy Agency (IEA), Special Report on Solar PV Global Supply Chains (2022), https://www.iea.org/reports/solar-pv-global-supply-chains.
9. International Energy Agency (IEA), Renewable electricity (2021), https://www.iea.org/reports/solar-pv-global-supply-chains.
10. Global Solar Atlas (2022), https://globalsolaratlas.info/map?c=48.908059,28.839111,6.
11. Siemens Aktiengesellschaft, Manufacture solar panels more efficiently and more sustainably (2022), https://new.siemens.com/global/en/markets/machinebuilding/solar-production-machines.html.
12. Schneider Electric Global, Homaya Solar Home Systems (2022), https://www.se.com/ww/en/product-category/8500-home-systems.
13. ABB Group, Solar power solutions, (2022), https://new.abb.com/solar.
14. Дніпровська міська Рада, Генеральний план розвитку міста Дніпро до 2026 року (2022), https://dniprorada.gov.ua/uk/articles/item/9178/generalnij-plan-rozvitku-mista-dnipropetrovska-do-2026-roku.
15. European Bank for Reconstruction and Development (EBRD), Green financing accounts for
majority of 2021 investments (2022), https://www.ebrd.com/news/publications/annual-report/annual-review-2021.html.
16. World Bank Group, Global Economic Prospects (2022), https://www.worldbank.org/en/publication/global-economic-prospects
17. International Energy Agency (IEA), Renewable electricity capacity growth by technology, main and accelerated cases (2022), https://www.iea.org/fuels-and-technologies/solar.
18. European Bank for Reconstruction and Development (EBRD), Project Finance Glossary (2022), https://www.ebrd.com/news/publications/essays-and-glossaries/project-finance-glossary-englishrussian-and-russianenglish.html.
19. European Bank for Reconstruction and Development (EBRD), Project investments are at the heart of our operations (2022), https://www.ebrd.com/work-with-us/project-finance.html.
20. European Commission, Carbon dioxide and Nitrogen management and valorisation (2022), https://ec.europa.eu/info/funding-tenders/opportunities/portal/screen/opportunities/topic-details/horizon-eic-2022-pathfinderchallenges-01-01