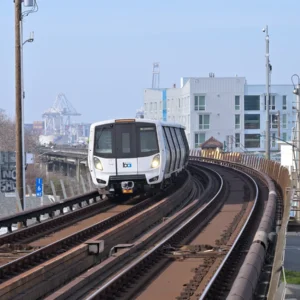
BART Greenhouse Gas Emissions Fall 69%, but GHG-Free Power Slips to 75%
BART greenhouse gas emissions fell 69% from 2015 to 2025 even as the Bay Area system opened five stations and increased annual train miles by about 11%.
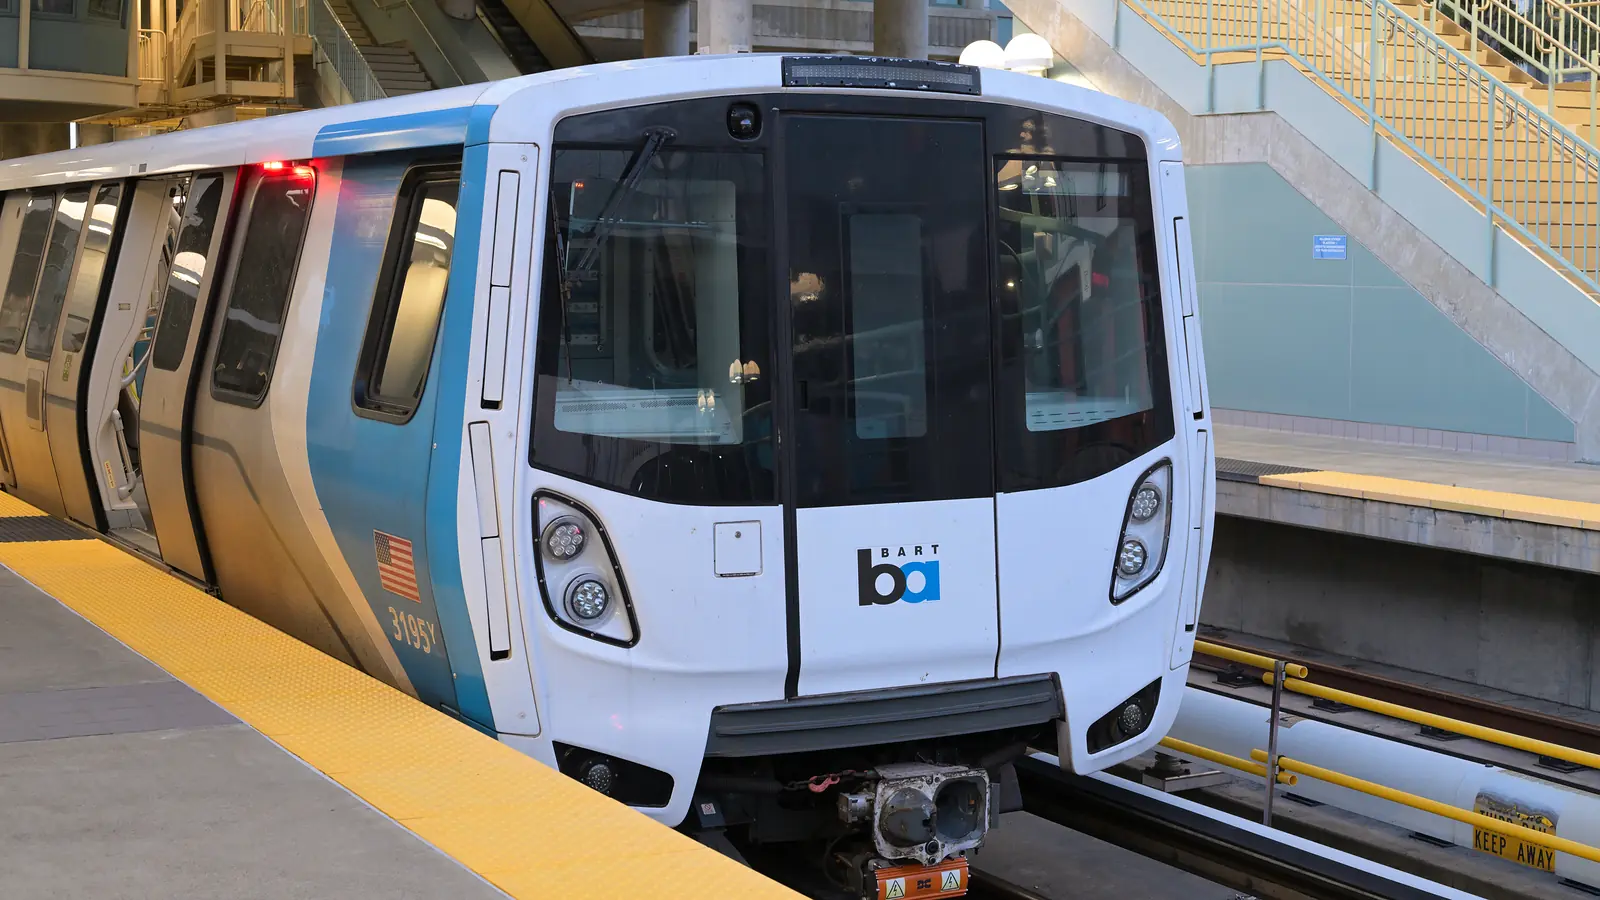
However, its Calendar Year 2025 sustainability report also shows the agency’s greenhouse gas-free power share slipping. Only 75% of the electricity BART contracted in 2025 came from greenhouse gas-free sources, down from 86% in 2024.
The report was released on September 11, 2026. It closes out the 2015-2025 Sustainability Action Plan, which BART published in 2017 with 2015 as the baseline year for many metrics. Of the 120 projects listed in that plan, BART counts 80 as finished or folded into routine operations.
How BART cut emissions over the decade
The report ties the long-term decline chiefly to how BART buys electricity. Under a wholesale electricity policy adopted in 2017, BART shifted from unspecified market power toward specified greenhouse gas-free supply. That year it also signed a pair of long-term power purchase agreements covering solar and wind generation in central California. By 2025, those contracts covered about 62% of its demand. In addition, BART buys from smaller solar and hydroelectric facilities.
The report credits that shift with a 68% cut from the 2015 baseline. Elsewhere in the same document, the decade figure appears as 69%. Meanwhile, total annual energy use fell 1.8% over the period.
Electricity makes up about 91% of BART’s energy use, with electric traction power alone taking 72%. The agency consumes around 363,000 MWh of electricity a year. According to the new action plan, BART’s power supply was 100% greenhouse gas-free in 2022.
Why the GHG-free power share fell in 2025
That share has since fallen. For 2025, BART says budget considerations forced it to delay signing new long-term renewable contracts. It also skipped extra short-term renewable purchases. Instead, the gap was covered with unspecified-source power, which carries no greenhouse gas-free designation. Renewable sources supplied 67% of BART’s electricity for the year.
Year-on-year emissions consequently rose for traction power, stations, offices, and shops and yards. By contrast, emissions from non-revenue vehicles and equipment declined. Lower energy use and some switching from renewable diesel to electricity helped there.
Measured per thousand vehicle revenue miles, emissions reached 0.62 metric tons of CO2 equivalent in 2025. That compares with 0.39 in 2024, 0.31 in 2023 and 0.07 in 2022. The 2015 baseline stood at 1.92. The 2025 figure missed both the committed target of 0.31 and the aspirational target of 0.24.
Energy use per vehicle revenue mile also stayed above target in 2025. At 20.92 megajoules, it exceeded the committed 19.52, although it dropped 2.5% from 2024. The report attributes the earlier rise from 2022 to 2024 to lower vehicle revenue miles. Among other changes, BART shortened its trains in September 2023, which left it running fewer revenue miles than planned.
| Year | Greenhouse gas emissions (metric tons CO2e per thousand vehicle revenue miles) | Energy use (megajoules per vehicle revenue mile) | Potable water use (gallons per vehicle revenue mile) |
|---|---|---|---|
| 2015 (baseline) | 1.92 | 21.19 | 0.64 |
| 2016 | 1.66 | 19.93 | 0.65 |
| 2017 | 0.22 | 20.52 | 0.86 |
| 2018 | 0.25 | 20.88 | 0.95 |
| 2019 | 0.27 | 20.48 | 0.85 |
| 2020 | 0.11 | 23.63 | 0.98 |
| 2021 | 0.10 | 21.69 | 0.78 |
| 2022 | 0.07 | 18.23 | 0.53 |
| 2023 | 0.31 | 19.34 | 0.68 |
| 2024 | 0.39 | 21.45 | 0.79 |
| 2025 | 0.62 | 20.92 | 0.83 |
| 2025 committed target | 0.31 | 19.52 | 0.43 |
| 2025 aspirational target | 0.24 | 19.19 | 0.38 |
In 2025 BART stayed above both 2025 targets on all three per-mile measures, although its greenhouse gas intensity remained about two-thirds below the 2015 baseline. Figures cover total district greenhouse gas emissions, total energy use and total potable water use. Source: BART, Calendar Year 2025 sustainability report, performance metrics table, p. 15. The comparison with the baseline is an editorial calculation: (1.92 − 0.62) ÷ 1.92 ≈ 68%.
How BART’s power mix looked before 2025
BART’s new action plan shows what the supply looked like before the 2025 decline. Eligible renewables made up about 61.5% of the fully greenhouse gas-free supply BART reached in 2022. In 2024, solar generation provided 34% of its power and wind 31%. Small hydroelectric plants added 6%, while large hydroelectric generation added 15%. The last 14% was unspecified power, which the plan says comes primarily from fossil fuels. Notably, one wind project, Sky River Wind in the Tehachapi Mountains, supplies almost a third of BART’s electricity.
Fleet, stations and riders
Most other 2025 measures were operational. Energy used by the non-revenue fleet dropped 32%. A shared vehicle pool at BART headquarters helped, replacing cars assigned to individual departments. BART also bought 32 electric trucks and vans and installed heat pump water heaters in five of its six shops. In addition, it signed an agreement to add EV charging at every parking facility BART manages.
Over three years, BART has fitted more than 90,000 LED lights across stations and parking sites. Stations that received complete LED overhauls have since cut total station energy use by more than 10%.
For riders, the report puts the carbon dioxide saved on a typical BART round trip at about 24.4 pounds.
BART’s 2030 emissions targets
The successor 2026-2035 Sustainability Action Plan was published in January 2026. It contains 72 action items and targets set for 2030. Unlike the earlier plan, it sets a single target per metric instead of committed and aspirational goals.
For greenhouse gases, BART aims for emissions 56% below a 2030 business-as-usual projection. That equals 0.138 metric tons per thousand vehicle revenue miles, counted as nonbiogenic emissions. For electricity, the plan targets a portfolio that is 100% zero-carbon by 2035. It then aims for supply entirely from eligible renewable sources by 2045.
| Metric | 2030 business-as-usual projection | 2030 target | Target versus projection |
|---|---|---|---|
| Energy use (megajoules per vehicle revenue mile) | 19.54 | 18.56 | 5% below |
| Nonbiogenic greenhouse gas emissions (metric tons CO2e per thousand vehicle revenue miles) | 0.310 | 0.138 | 56% below |
| Station water use (gallons per rider) | 0.54 | 0.42 | 23% below |
| Shops and yards water use (gallons per vehicle revenue length) | 27,526 | 24,374 | 11% below |
| Recycle contamination rate at stations (by volume) | 21% | 16% | 25% below |
| Recyclables capture rate at stations (by volume) | 53% | 66% | 25% above |
Each 2030 target is set against a projection of what would happen without further action, not against 2025 results. The greenhouse gas target counts nonbiogenic emissions only, so it is not directly comparable with the total emissions figures reported for 2015–2025. Source: BART, 2026-2035 Sustainability Action Plan, Tables 2, 3, 5 and 7, pp. 20, 22, 28 and 40.
The plan expects the wholesale electricity policy to deliver the largest share of those reductions. At the same time, it describes that policy as vulnerable to high energy costs and financial considerations. BART puts its structural deficit at $350 million to $400 million, and its emergency funds run out in fiscal year 2027. Meanwhile, a regional funding measure authorized by Senate Bill 63 goes before voters in November 2026.
Separately, the report says a change to California’s Low Carbon Fuel Standard means BART could earn about $20 million a year from credits for its electric operations. BART says it will publish annual sustainability reports under the new plan.