FTA Dashboard Compares US Transit Agency Performance
USA: The Federal Transit Administration has launched a nationwide dashboard comparing transit agency performance across safety, accessibility and operating efficiency, giving riders direct access to federal data previously presented in spreadsheets.
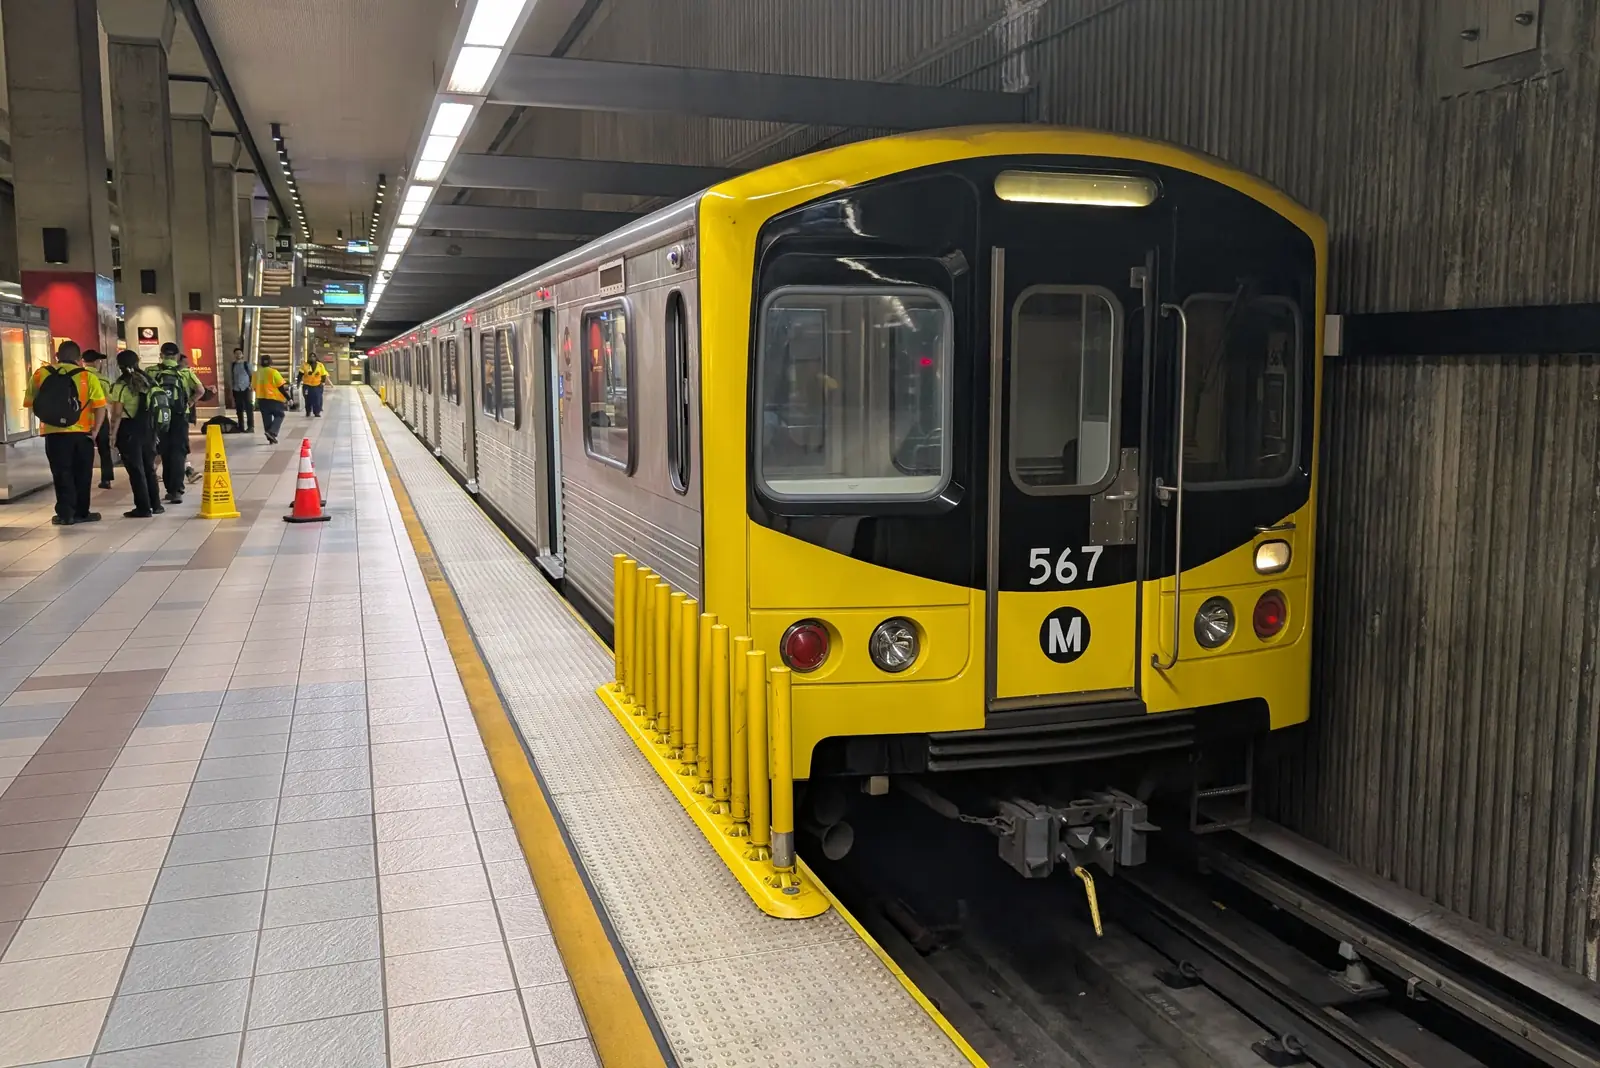
The new Transit Moves America dashboard uses information collected through the National Transit Database and covers both rail and bus operations. It publishes national averages alongside agency-level results, with safety and security metrics scheduled for monthly refreshes and accessibility and efficiency figures updated annually.
Data for the 25 largest urban areas also combines results from multiple operators where metropolitan regions have more than one transit provider. This creates a single view of operating cost per passenger trip as well as separate comparisons for safety and accessibility.
Rail security rates show wide agency differences
US rail transit systems average fewer than 0.3 federally reportable passenger security incidents per 1 million trips. Dallas Area Rapid Transit records 2.53 incidents per million, the highest rate among the 58 agencies shown and the only result above 2.0; seven other agencies exceed 1.0.
The national rate for worker incidents is 0.07 per million trips. TriMet in Portland, Oregon, has the highest agency rate at 0.28.
“This new dashboard brings key performance data out of obscure spreadsheets and puts it in the hands of American transit customers to make better-informed travel decisions,” FTA Acting Deputy Administrator Matthew Cahill said in the official announcement.
Don’t miss…BNSF Says CN Access Deal Undercuts UP–NS Merger Case
Accessibility improves while operating costs vary
The share of rail stations meeting Americans with Disabilities Act standards rose from 68.5% in 2014 to 77% in 2024. Locations where passengers board from the street are excluded. Fifty-three of the 70 listed agencies report 100% station accessibility, with LA Metro the largest of that group at 103 compliant stations.
Operating costs range widely. Las Vegas has the lowest figure at $6.15 per trip, followed by the six agencies serving the New York City area at $6.92. Sacramento Regional Transit records the highest figure at $18.46. New York, Los Angeles and Chicago are all among the five metropolitan areas with the lowest costs per trip.
The launch also complements FTA’s separate request for information on transit service quality, which covers safety, cleanliness, universal accessibility, real-time service data and system reliability. Published June 4, the consultation remains open for comments until August 3, 2026.
News on railway transport, industry, and railway technologies from Railway Supply that you might have missed: